
Just like in some cases, “the whole is greater than the sum of its parts”, in machine learning, “the performance of the model is not a reflection of the sum of its sub-groups.”
Indeed, the good performance of machine learning models does not necessarily mean that every sub-group is optimized. Quite the contrary. Models don’t perform identically on different sub-groups of input data. For instance, in a marketing use case, if a campaign is targeting new users that are a completely new input, one can assume that the predictions for this specific sub-group will not be optimal, as the model was NOT trained on this data. The most common examples of this would be the face recognition systems whose training data sets don’t include a wide enough variety of ethnicity and who fail to identify minorities.
It could also be that the low performance is the result of a classifier’s reliance on specific features. For example, practitioners have noted that for some skin cancer detection datasets, models are more accurate on images of benign skin lesions having visible bandages as compared to images having no bandages.
Yet, to assure that models make the impact they were designed for, subpopulations are of crucial importance. Think about VIP customers in a gaming use case or about specific cities or regions if you are using the same model for different instances.
These subpopulations have a tremendous importance for the business and for the “real life” implications of the predictions, and should be measured and monitored in a manner that reflects their importance.
This is where the necessity to oversee the performance of models in production and automatically understand degradations at the sub-group level becomes obvious.
Without monitoring the model performance at the right level, it can take weeks for data science and data engineering teams to understand that there is a degradation and to identify the root cause. Very often, these degradations remain completely “silent” and hard to detect, as they are hidden within the overall population performance.
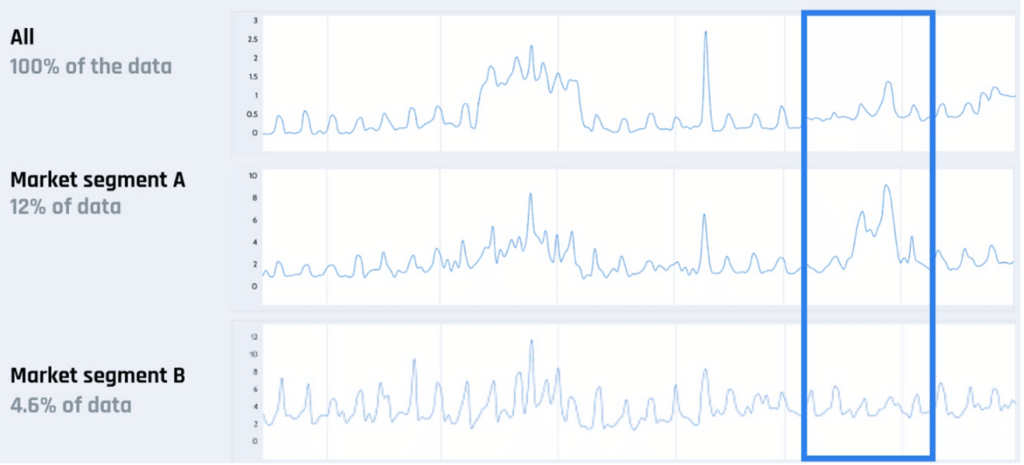
As one can see below, market segment A is clearly experiencing drift, while the overall data and segment B reflect a different reality…. And that’s even without mentioning the impact on the downstream users and the business as a whole.
What’s more, monitoring sub-populations also require the selection of adequate metrics. Some metrics, like AUC, are not cumulative and cannot show degradations at the granular level. Or, if you decided to measure the “mean error” value of your selected metric for a regression use case, then the performance of subpopulations with two contrary behaviors may appear null.
Yet, monitoring should not only focus on the performance but also include the input and inferences to gain visibility on changes that may impact the model’s performance. In turn, this helps diagnosing performance issues and taking appropriate corrective actions, before serious damage is done.
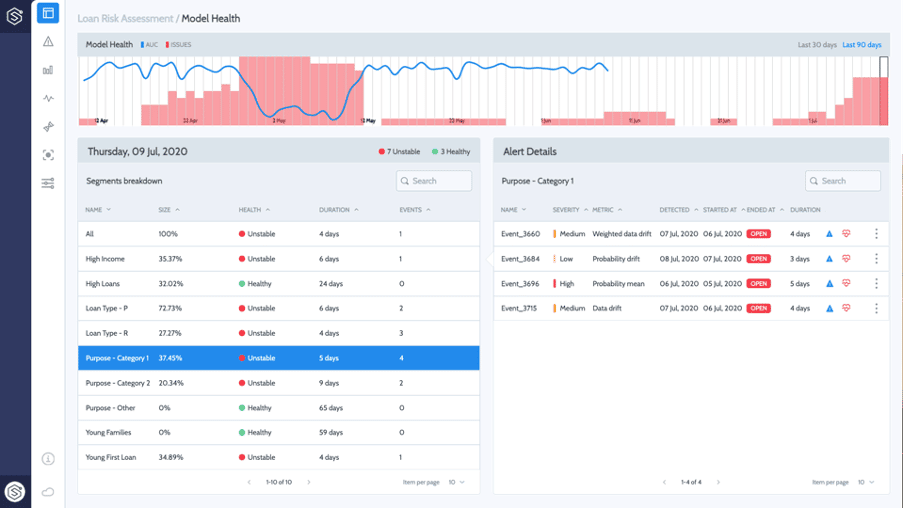
Here are some of the insights that can be uncovered about sub-group behavior in production with a dedicated monitoring solution:
· What is the performance of each sub-group separately
· For how long did the change/drift/anomaly last?
· What features, if any, are responsible for the change?
Overall, by leveraging the insights gathered from the monitoring service, the data science team is also able to select the most appropriate corrective action:
1. Re-training the model with additional or new data
2. Use different models for the overall populations and for the problematic sub-segments or “tenants”.
A granular view of models in production is not only necessary to assure the performance of the models and its business impact but also to optimize the overall ML flow and power better insights for retraining and future models iterations.
At Superwise, we already monitor millions of transactions every day across any use case and help data science, data engineering, and operational teams assure the health of their models in production. Feel free to reach out to us to brainstorm or learn more about what we do.
To be very forthcoming, we have also published a full e-book about the best practices for ML monitoring. Feel free to download it here!
Everything you need to know about AI direct to your inbox
Superwise Newsletter
Superwise needs the contact information you provide to us to contact you about our products and services. You may unsubscribe from these communications at any time. For information on how to unsubscribe, as well as our privacy practices and commitment to protecting your privacy, please review our privacy policy.